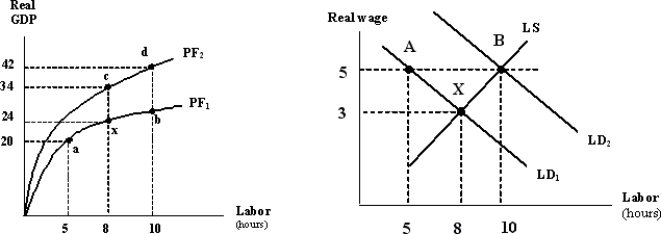
The graphs below depict the production function and labor market for an imaginary economy. The economy is, initially, at points x and X.
 Figure 1 Figure 2
-An increase in labor productivity shifts the labor curve .
Definitions:
Barriers To Entry
Obstacles that prevent or hinder new competitors from easily entering an industry or area of business.
Long Run
A period of time in economics during which all factors of production and costs are variable, allowing for all possible adjustments, including changes in industry size.
Natural Monopoly
A market structure where a single firm can produce the entire market supply of a particular good or service at a lower cost than any potential competitor.
Network Effects
Network effects occur when the value of a product or service increases as more people use it, making it more attractive and beneficial to users.
Q12: Slowdonia's current growth rate of real GDP
Q158: The gap between real GDP per person
Q186: In the market for loanable funds, an
Q211: The curvature of the production function shows
Q215: If the price level increases and workers'
Q230: The real wage rate can best be
Q319: The subsistence real wage rate is the<br>A)
Q351: A decrease in the real wage rate<br>A)
Q402: A higher savings rate that leads to
Q442: A bank has reserves of $50, deposits