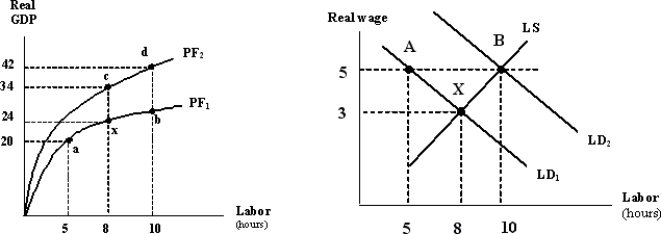
The graphs below depict the production function and labor market for an imaginary economy. The economy is, initially, at points x and X.
 Figure 1 Figure 2
-An increase in labor productivity shifts the labor curve .
Definitions:
Sampling Method
A technique used in statistics to select a subset of individuals from a population to estimate characteristics of the whole population.
Consumer Products
Goods sold directly to the consumer for personal, family, or household use, as opposed to products intended for industrial or commercial use.
Continuous Process
A production process that operates continuously without interruption, commonly employed in manufacturing and chemical industries to produce goods or substances.
Sampling Error
The error that occurs when the sample selected is not perfectly representative of the whole population, leading to inaccuracies in results.
Q15: Over the past 100 years, real GDP
Q82: In the above figure, at the real
Q110: Suppose the population is 220 million people,
Q155: During a recession, people drop out of
Q192: Unemployment caused by people voluntarily leaving their
Q209: Unemployment as measured includes the total number
Q251: Which of the following are included in
Q406: Hu Tells Leaders China Growth Will Help
Q419: According to the quantity theory of money,
Q429: If the desired reserve ratio rises, the