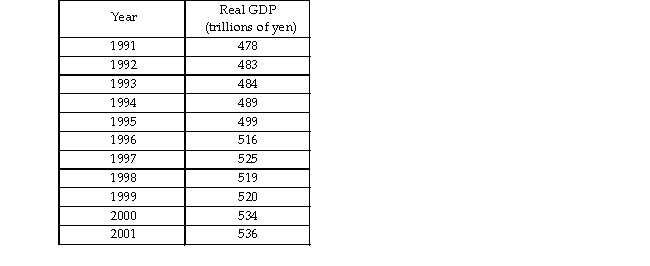
-The table above shows Japan's real GDP between 1991 to 2001.
a) Draw a figure with Japan's real GDP from 1991 to 2001.
b) In the previous 30 years, the growth rate of Japan's potential GDP was 6 percent a year. On your graph, show path that potential GDP would have followed if its GDP in 1991 was equal to potential GDP and the growth rate potential GDP had been maintained in 1991- 2001.
c) Show the Lucas wedge on your figure.
Definitions:
Q180: Which of the following means that the
Q238: The largest component of GDP in the
Q241: The table below shows the price index
Q249: In the above figure, a recession begins
Q278: The data show Argentina's GDP (using purchasing
Q305: When the quantity demanded equals quantity supplied<br>A)
Q336: The word "final" in the definition of
Q371: When graphing a demand curve for corn,
Q410: "The new goods bias puts a downward
Q533: An increase in the number of producers