Multiple Choice
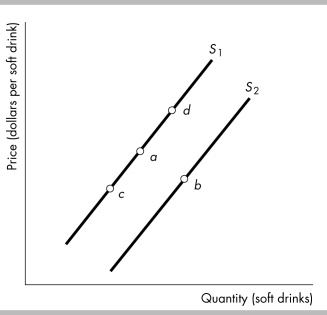
-Consider the figure above showing supply curves for soft drinks. Suppose the economy is at point
A. An increase in the number of suppliers would be shown as a movement from point a to a point such as
Definitions:
Related Questions
Q54: Which of the following is NOT a
Q59: Which of the following is a component
Q65: The income approach measures GDP by adding
Q73: List the components of the expenditure approach
Q179: A normal good is a good for
Q255: Which of the following best reflects an
Q278: We observe that the equilibrium price of
Q314: Suppose the market for CD- Rs has
Q346: The underground economy exists for all of
Q421: In the figure above, which movement reflects