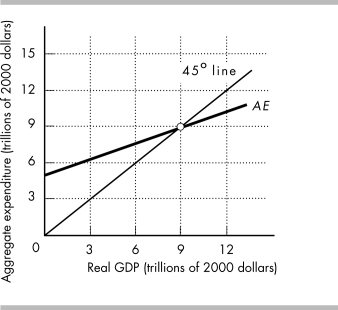
-The above figure shows the AE curve and 45° line for an economy.
a) If real GDP equals $6 trillion, how do firms' inventories compare to their planned inventories?
b) If real GDP equals $12 trillion, how do firms' inventories compare to their planned inventories?
c) What is the equilibrium level of expenditure? Why is this amount the equilibrium?
Definitions:
Cash-Out Situation
A scenario where an individual withdraws funds from an investment or refinances a property to access the equity built up, often resulting in immediate liquid cash.
Restrictive Policy
A policy that limits or restricts certain actions, typically implemented to control financial practices or prevent excessive risk-taking.
Inventory
The total amount of goods and materials held by a company intended for sale or used in the production of goods sold.
Optimal Current Asset Holdings
Refers to the ideal mix of cash and other current assets a company maintains to meet its operational and investment needs effectively and efficiently.
Q85: In the above figure, at the point
Q169: List the four components of aggregate expenditure.
Q231: If the money wage and other resource
Q256: The above figure illustrates<br>A) a full- employment
Q268: The table above gives the aggregate demand
Q281: Business cycle turning points are<br>A) easy to
Q314: economists believe that the economy is self-
Q362: What is the relationship between U.S. real
Q370: In the above table, there are no
Q463: The slope of the consumption function is<br>A)