Multiple Choice
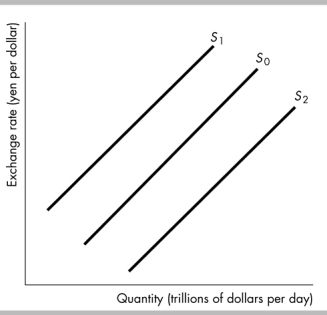
-In the figure above, the shift in the supply curve for U.S. dollars from S0 to S2 could occur when
Definitions:
Related Questions
Q30: The horizontal axis on a time- series
Q110: Since the mid 1980s, the United States
Q144: What is the relationship between net exports,
Q168: Which of the following accounts records the
Q349: The slope of the line in the
Q360: Suppose the exchange rate between the U.S.
Q365: On a graph, high correlation between the
Q397: Money market mutual funds<br>A) allow shareholders to
Q449: If 100 Japanese yen buy more U.S.
Q597: In evaluating a relationship between x and