Related Questions
Q38: Normal goods are those for which demand
Q44: The income approach to measuring GDP<br>A) sums
Q134: Net investment equals gross investment minus depreciation.
Q144: If the price of a candy bar
Q149: If the price of a CD is
Q188: Why is unemployment a problem?
Q216: The statement that ʺdemand increasesʺ means that
Q293: Using the data in the above table,
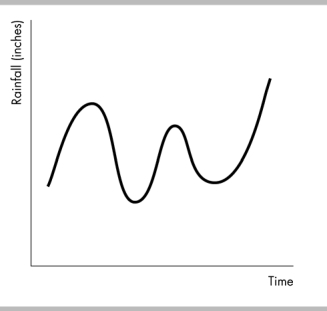
Q331: In the above figure, the diagram shows<br>A)
Q467: The above table gives the demand and
