The diagram below shows two budget deficit functions for a hypothetical economy. 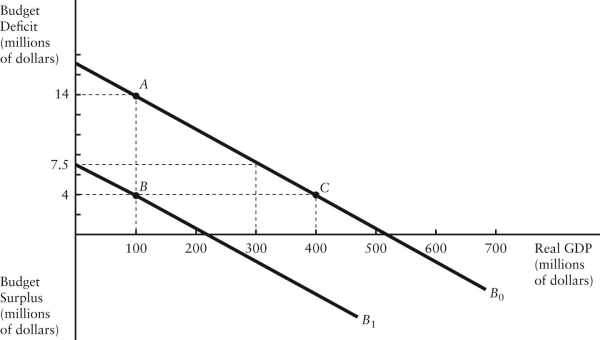 FIGURE 31-2
-Refer to Figure 31-2.Initially,suppose real GDP is $100 million and the budget deficit is $14 million,as shown by point A.Which of the following events could result in a move from point A to point C?
Definitions:
Price Fall
A reduction in the market price of a good or service, which can influence consumer behavior and economic conditions.
Demand Function
A mathematical expression that shows the relationship between the quantity demanded of a good and its price, holding other factors constant.
Elasticity
A measure of how much the quantity demanded or supplied of a good responds to a change in price or other economic variables.
Elasticity of Demand
Quantifies the change in demand for a commodity in response to its price movements.
Q12: Ceteris paribus, a rightward shift of the
Q17: Until the onset of the most recent
Q20: Consider a Government of Canada bond with
Q29: Consider Canadaʹs balance of payments. If Canadaʹs
Q45: Other things being equal, an increase in
Q61: Suppose Canada implements new border procedures that
Q64: Suppose Canada reduces a tariff on imported
Q75: Consider the government of a small economy
Q81: Refer to Table 32-6. Suppose the world
Q117: In general, the sacrifice ratio will be