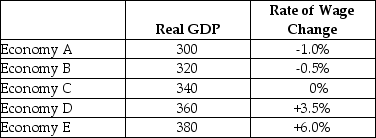
The table below shows data for five economies of similar size.Real GDP is measured in billions of dollars.Assume that potential output for each economy is $340 billion.
 TABLE 24-1
-Refer to Table 24-1.How is the adjustment asymmetry demonstrated when comparing Economy A to Economy E?
Definitions:
Personal Traits
Inherent characteristics or qualities that define an individual's behavior, attitude, and personality.
Entrepreneurs
Individuals who initiate, manage, and take on the risks of a business or enterprise, often bringing innovation and change.
Entrepreneurial Success
Achieving desired business outcomes, which can include profitability, growth, market share, and sustainability in entrepreneurship.
Debt Financing
The raising of capital through borrowing, which typically involves taking out loans or issuing bonds.
Q15: Which of the following will cause a
Q22: When desired consumption exceeds disposable income, desired
Q60: Consider the relationship between the AE curve
Q63: Changes in monetary aggregates such as M2
Q76: Suppose that real national income Y) is
Q78: Suppose Canadian real GDP is equal to
Q103: Consider the following news headline: ʺChina signs
Q107: In a simple macro model, a decrease
Q115: In a simple macro model with a
Q115: Refer to Figure 21-3. If national income