The table below shows data for five economies of similar size.Real GDP is measured in billions of dollars.Assume that potential output for each economy is $340 billion.
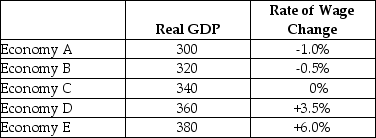 TABLE 24-1
-Refer to Table 24-1.In which economy is there the most unused capacity?
Definitions:
Long-Run Supply Curve
A graphical representation showing the relationship between the price of a good and the quantity supplied over a long period, accounting for adjustments in all factors of production.
Short-Run Supply Curve
A graphical representation showing the relationship between the price of a good and the amount that producers are willing to supply, over a short period.
Output
The quantity of goods or services produced by a firm, industry, or economy in a given time period.
Average Variable Cost
The total variable costs divided by the quantity of output produced, indicating the variable cost of producing each unit.
Q4: Note: This question requires a calculator with
Q8: Consider the following news headline: ʺCanadian business
Q24: Undesired or unplanned inventory accumulation is likely
Q44: High and uncertain inflation is damaging to
Q67: According to the Neoclassical growth model, it
Q81: How does the Bank of Canada set
Q109: Jeff and Loriʹs disposable income rose from
Q109: Suppose output is at its potential level
Q123: Refer to Figure 21-1. The APC will
Q133: Consider a consumption function of the following