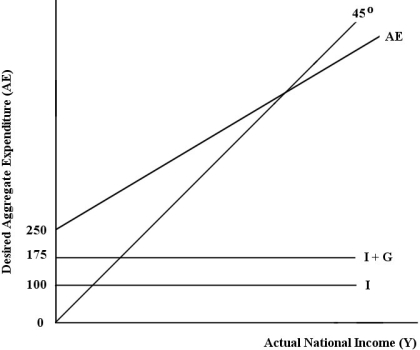
The diagram below shows desired aggregate expenditure for a hypothetical economy. Assume the following features of this economy:
· marginal propensity to consume mpc) = 0.75
· net tax rate t) = 0.20
· no foreign trade
· fixed price level
· all expenditure and income figures are in billions of dollars.
 FIGURE 22-2
-Refer to Figure 22-2. Which of the following equations describes the aggregate expenditure function for this economy?
Definitions:
Transfer Payments
Payments made by the government to individuals, without the government receiving any goods or services in return.
Nondiscretionary Fiscal Policy
involves government policies, like taxation and certain types of government spending, that are not easily altered and automatically adjust to economic conditions.
Aggregate Demand
The whole of economic demand for goods and services at a given price level, within a certain time range.
Federal Budget
A government's plan for revenue and spending over a specific period.
Q7: Other things being equal, a rise in
Q31: Consider a simple macro model with a
Q60: Consider the relationship between the AE curve
Q81: The Solow residual is an estimate of
Q94: Consider the AD/AS macro model. The wage-adjustment
Q114: When an economy experiences sustained growth in
Q116: GDP from the expenditure side is equal
Q118: Long-run economic growth can help alleviate the
Q122: Which of the following is a defining
Q125: Refer to Figure 25-1. Which of the