The diagram below shows desired aggregate expenditure for a hypothetical economy. Assume the following features of this economy:
· marginal propensity to consume mpc) = 0.80
· net tax rate t) = 0.15
· no foreign trade
· fixed price level
· all expenditure and income figures are in billions of dollars.
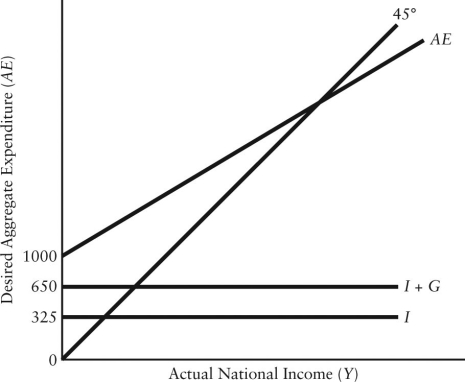 FIGURE 22-3
-Refer to Figure 22-3. Which of the following equations describes the aggregate expenditure function for this economy?
Definitions:
Replacement Cost
Cost to replace a firm’s assets. Also called reproduction cost.
Economic Income
The sum of a company's net cash flow and the change in present value of a company's cash flows in a given period.
ROA
Return on Assets, a financial ratio indicating the profitability of a company relative to its total assets.
Capital Structure
The mix of a company's long-term debt, specific short-term debt, common equity, and preferred equity, which is used to finance its overall operations and growth.
Q22: Consider the basic AD/AS model with an
Q30: Refer to Figure 22-5. Diagram 2 illustrates
Q52: The most common measure of productivity is
Q57: In Canada, the corporate income tax is
Q65: Economic growth allows increasing numbers of people
Q66: If the price index is P1 in
Q116: GDP from the expenditure side is equal
Q122: Which of the following is a defining
Q142: Consider the simplest macro model with demand-determined
Q156: Consider a simple macro model with a