The diagram below shows desired aggregate expenditure for a hypothetical economy.Assume the following features of this economy:
∙ marginal propensity to consume (mpc) = 0.80
∙ net tax rate (t) = 0.15
∙ no foreign trade
∙ fixed price level
∙ all expenditure and income figures are in billions of dollars. 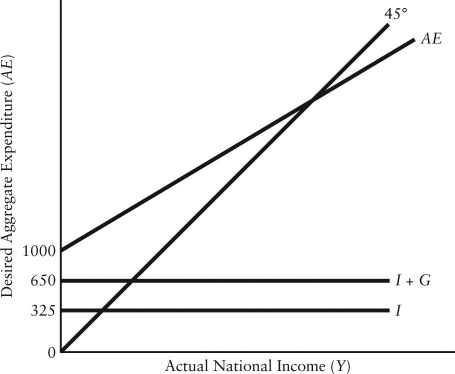 FIGURE 22-3
-Refer to Figure 22-3.What is total autonomous expenditure?
Definitions:
Equity Multiplier
A financial leverage ratio that measures the proportion of a company's assets that are financed by stockholders' equity.
Dividend Yield
The ratio of a company's annual dividend payments to its share price, reflecting the earning potential from dividends for investors.
Receivable Turnover
A financial metric that measures the efficiency of a company in extending credit and collecting debts, calculated as sales divided by the average accounts receivable.
Inventory Turnover
An indicator of the number of times a firm's inventory turnover occurs during a certain period, demonstrating the effectiveness of its inventory control practices.
Q8: Consider a simple macro model with demand-determined
Q32: The federal corporate income tax in Canada
Q33: Consider the simplest macro model with a
Q37: Suppose the economy has a high level
Q37: Fiscal policy involves the governmentʹs use of
Q40: For a given level of private saving,
Q54: Which of the following is required to
Q64: In the basic AD/AS macro model, the
Q101: Suppose aggregate output is demand-determined. If the
Q105: One of the reasons why the aggregate