The table below shows total output for an economy over 2 years.
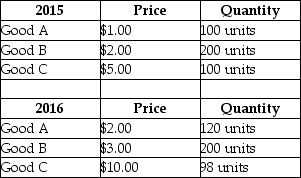 TABLE 20-5
-Refer to Table 20-5.Assume the output of all three goods is consumed in the country,and there are no imported goods and services.If 2015 is used as the base year,then the consumer price index (CPI) in 2016 was approximately
Definitions:
Compounding
The process whereby interest is added to the principal sum, so that from that moment on, the interest that has been added also earns interest.
Demand Curve
A graph representing the relationship between the price of a good and the quantity demanded, with price on the vertical axis and quantity on the horizontal axis.
Loanable Funds
The money available for borrowing in the financial markets, determined by savings and investments.
Savers
Individuals or entities that set aside a portion of current income for future use, often by depositing money in savings accounts or investing in securities.
Q4: In the basic AD/AS model, the effect
Q8: Consider the following news headline: ʺCanadian business
Q16: An increase in foreign income, other things
Q50: Refer to Table 21-8. The simple multiplier
Q86: If the economy is in macroeconomic equilibrium
Q91: Which of the following would likely cause
Q111: Which of the following statements about public
Q113: Refer to Table 21-4. At the equilibrium
Q117: Consider a simple macro model with a
Q156: Consider a simple macro model with a