The three diagrams below each show a supply curve for oil tankers over a relatively short period of time. 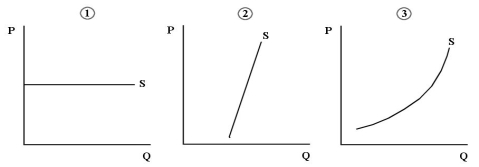 FIGURE 13-3
-Refer to Figure 13-3.Consider the supply of oil tankers to an individual Canadian shipping firm,the North American shipping industry,and the world shipping industry.Which diagram best shows the supply of oil tankers that is relevant to the world shipping industry?
Definitions:
AVC Curve
A graph that represents the average variable cost of producing each quantity of output, showing how these costs vary with changes in output levels.
Short-Run Situation
A period in which at least one of a firm's inputs is fixed, limiting its capacity to adjust output levels quickly.
Marginal Revenue
The increase in revenue a business gets from the sale of an extra unit of a product or service.
Marginal Cost
The incremental cost of producing an additional unit of a product or service.
Q11: The Employment Insurance EI) system operates whereby<br>A)
Q11: A single-price monopolist is currently producing an
Q28: Which of the following is the best
Q34: Refer to Figure 10-5. If this single-price
Q45: Other things being equal, if it becomes
Q61: A paper mill discharges chemicals into a
Q67: The problem with externalities is essentially one
Q80: Suppose all Canadians earned equal incomes. In
Q109: As a method of pollution control, tradable
Q122: One reason airlines charge a higher price