Multiple Choice
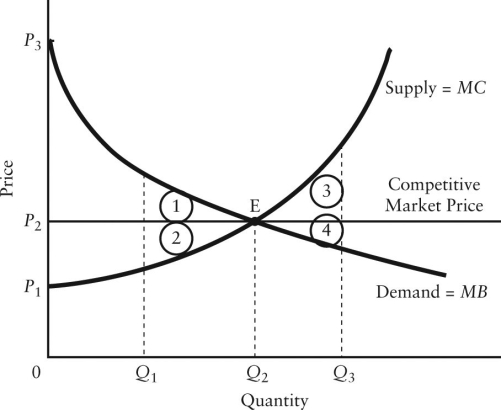
The diagram below shows the demand and supply curves in a perfectly competitive market.
 FIGURE 12-5
-Refer to Figure 12-5. In the free-market equilibrium, producer surplus is shown by the area
Definitions:
Related Questions
Q21: Refer to Figure 12-5. If output in
Q72: Refer to Figure 14-5. If this labour
Q76: On a graph showing a firmʹs TC
Q82: Refer to Table 8-1. If the price
Q94: Kobe Bryant is a highly paid professional
Q96: The banning of wood-burning stoves and fireplaces
Q96: A temporary factor-price differential is one which<br>A)
Q100: When comparing a perfectly competitive firm and
Q102: A monopolistically competitive firm and a monopoly
Q146: For any firm operating in any market