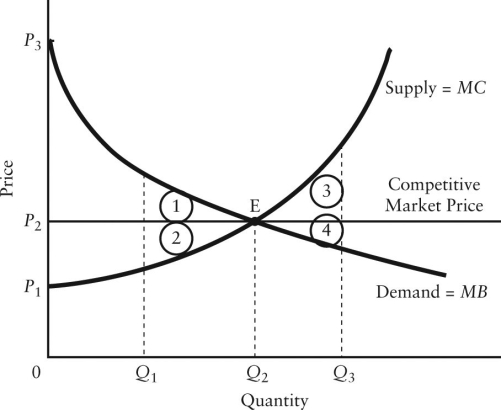
The diagram below shows the demand and supply curves in a perfectly competitive market.
 FIGURE 12-5
-Refer to Figure 12-5. If output in this market were Q3, and the price were still P2, the loss in consumer surplus relative to the competitive equilibrium would be illustrated by area
Definitions:
Tacit Collusion
A form of collusion among competing firms in an industry to raise prices or slow production informally without a direct agreement.
Price Leadership
A pricing strategy where a dominant firm in the market sets the price of goods or services, and other competitors follow.
Tacit Collusion
An unofficial agreement among competitors to limit competition and keep prices high, without explicit communication or legal contracts.
Price Leadership
A strategy where the leading firm in a market sets the price of goods or services, and other firms in the market follow suit.
Q6: All Canadian provincial governments have legislated minimum
Q15: Refer to Figure 12-4. What is the
Q20: When economists say that a firm is
Q23: Suppose that a single-price monopolist calculates that
Q64: Suppose all of the firms in a
Q94: Government intervention in an effort to promote
Q98: A free-market economy with perfect allocative efficiency
Q101: Which one of the following is a
Q120: An efficient amount of a public good
Q120: Other things equal, if a particular province