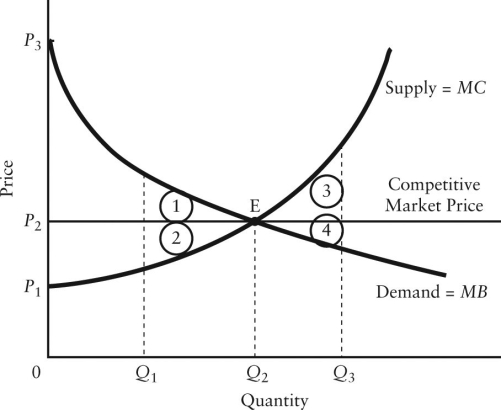
The diagram below shows the demand and supply curves in a perfectly competitive market.
 FIGURE 12-5
-Refer to Figure 12-5. Allocative efficiency occurs
Definitions:
Financial Statements
Reports that present the financial performance, position, and cash flows of a company, used by stakeholders to make informed decisions.
Generally Accepted Accounting Principles
A framework of accounting rules, standards, and procedures that companies must follow when compiling their financial statements in the United States.
Modified Opinion
A type of audit opinion suggesting that the auditor has reservations about certain aspects of the company's financial statements.
Qualified Opinion
An auditor's opinion suggesting that the financial statements of a firm are fairly presented, except for a particular area or exception.
Q20: If a monopolistʹs marginal revenue is MR
Q29: For a monopolist, the profit-maximizing level of
Q49: Global greenhouse-gas GHG) emission reductions are unlikely
Q50: The excess-capacity theorem predicts that<br>A) when price-taking
Q52: Suppose a firm is using 100 units
Q76: The ʺsize distribution of incomeʺ refers to
Q107: Refer to Figure 9-1. The diagram shows
Q121: Refer to Table 13-4. What is the
Q127: A perfectly competitive firm facing a price
Q132: Average revenue AR) for an individual firm