The diagram below shows the market demand curve and the cost curves for a single firm.
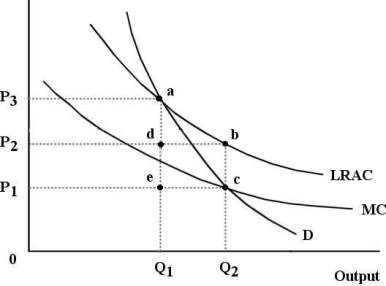 FIGURE 12-6
-Refer to Figure 12-6.Suppose this firm is being regulated using a policy of average -cost pricing.In this case,economic profits to the firm are represented by the area
Definitions:
Long-Run Equilibrium
A state in which all factors of production and inputs can be adjusted by firms, leading to a situation where no firm has an incentive to change its output or production method.
LRAC Curve
Long-Run Average Cost Curve, a graphical representation showing the minimum cost at which any output level can be produced in the long run.
Exiting Firms
Businesses that are leaving a particular market due to various reasons such as unprofitability, strategic realignment, or market saturation.
Increasing-Cost Industry
An industry in which production costs increase as the industry's output expands.
Q12: Suppose there are only five construction companies
Q18: Suppose that in a perfectly competitive industry,
Q54: Refer to Figure 12-3. The area representing
Q57: An oligopolistic firm often detects a change
Q63: Refer to Figure 13-1. Suppose this firm
Q78: The fact that it is difficult to
Q84: Refer to Figure 11-2. A perfectly competitive
Q98: Monopolistic competition is similar to perfect competition
Q104: Assume a firm is using 10 units
Q117: In the long run it is not