Multiple Choice
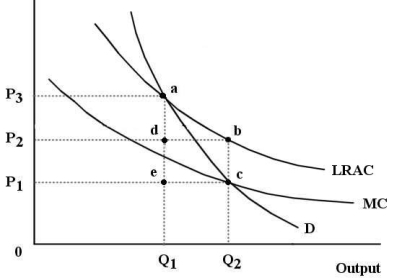
The diagram below shows the market demand curve and the cost curves for a single firm.  FIGURE 12-6
-Refer to Figure 12-6.Suppose this firm is being regulated using a policy of marginal-cost pricing.To maintain the resulting level of output
Definitions:
Related Questions
Q19: If typical firms in a competitive industry
Q56: Refer to Figure 9-4. Given its total
Q63: Suppose the market for some product can
Q66: Refer to Figure 13-1. Suppose this firm
Q89: Suppose a perfectly competitive firm is producing
Q99: ʺThe bigger the volume, the lower the
Q108: Refer to Figure 12-4. Suppose a disequilibrium
Q112: Consider a natural monopoly that is producing
Q114: Long-run equilibrium in a perfectly competitive industry
Q118: A single-price monopolist is currently producing an