The figure below shows the demand schedule and demand curve for a product produced by a single-price monopolist. 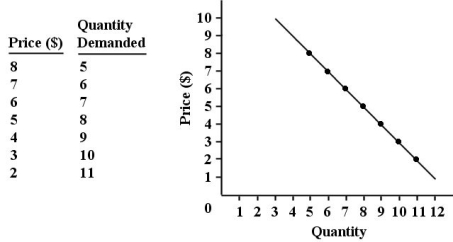 FIGURE 10-1
-Refer to Figure 10-1.Suppose this single-price monopolist is initially selling 9 units at $4 each and then reduces the price of the product to $3.By making this change,the firm is giving up revenue of ________ on the original number of units sold and gaining revenue of ________ on the additional units sold.Its marginal revenue is therefore ________.(All figures are dollars)
Definitions:
RUPA
Stands for the Revised Uniform Partnership Act, governing the operation of partnerships in the United States.
Termination
The act of ending something, such as a contract, employment, or agreement.
Heated Disagreement
An intense argument or conflict between individuals or groups.
Dissociation
The process through which a member of a business entity severs their connection or association with that entity.
Q9: The slope of a firmʹs isocost line
Q38: If a regulatory agency imposes a lump-sum
Q39: A Lorenz curve shows the<br>A) degree of
Q40: Refer to Table 7-4. The total fixed
Q77: Suppose that the professional association of dentists
Q79: Consider a monopolistically competitive industry in long-run
Q92: Canada has a much lower population density
Q109: Refer to Figure 10-6. Assume this pharmaceutical
Q115: Suppose there is a competitive market for
Q153: Refer to Table 9-3. Suppose the prevailing