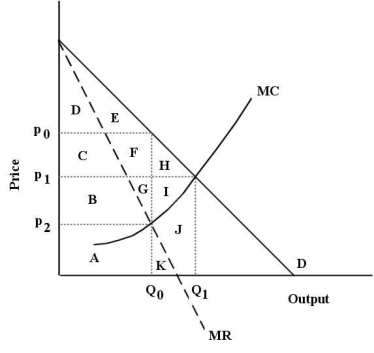
The diagram below shows the demand curve and marginal cost and marginal revenue curves for a new heart medication for which the pharmaceutical firm holds a 20-year patent on its production and sales.This protection gives the firm monopoly power for the 20 years of the patent.  FIGURE 10-6
-Refer to Figure 10-6.Assume this pharmaceutical firm charges a single price for its drug.At its profit-maximizing level of output,it will generate a deadweight loss to society represented by
Definitions:
Compounded Annually
The process where the interest earned on an investment is reinvested, and future interest payments are calculated on the principal plus previously earned interest.
Ending Balance
The total amount remaining in an account at the conclusion of a reporting period or after a specific transaction has been completed.
Compounded Annually
Refers to the process where the interest earned on an investment is added to the principal sum at the end of each year, then interest for the next period is calculated on the new principal.
Rate Of Return
The gain or loss of an investment over a specified period, usually expressed as a percentage of the investment's initial cost.
Q10: Consider the efficiency of various market structures.
Q27: Suppose a firm is using 1500 units
Q28: Refer to Figure 9-1. The diagram shows
Q29: Suppose that in a perfectly competitive industry,
Q57: Refer to Figure 12-5. At the free-market
Q82: Refer to Table 8-1. If the price
Q91: Suppose the technology of an industry is
Q116: If a firm is a perfect competitor
Q119: A firmʹs short-run marginal cost curve is
Q123: A firm is best described as a