The figure below shows the isocost lines facing a firm producing golf tees.
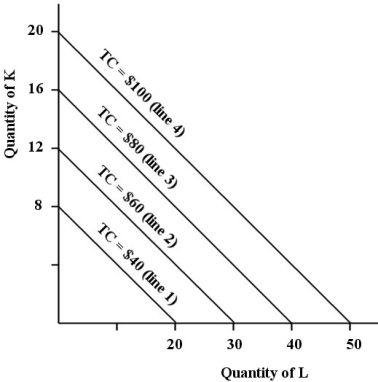 FIGURE 8-5
-Refer to Figure 8-5. The firm that is facing the isocost lines as shown will minimize its cost of production of any given output level if it employs capital and labour such that the ratio of the marginal product of labour to the marginal product of capital MPL/MPK) is equal to
Definitions:
Variable Overhead Cost Variance
The difference between the actual variable overhead costs incurred and the expected (or standard) costs, based on the actual level of activity.
Fixed Overhead Cost Variance
The difference between the actual fixed overhead costs incurred and the expected (or budgeted) fixed overhead costs.
Variable Overhead Efficiency Variance
A calculation that shows the cost impact of the difference between the actual and expected efficiency in using variable overhead resources in production.
Relevant Information
Data that can influence a decision-making process because it is pertinent and has a bearing on the situation.
Q10: Suppose a firm with the usual U-shaped
Q12: One measure of the extent of market
Q19: Marginal utility theory is about<br>A) the consumer
Q26: When the percentage change in quantity demanded
Q42: Which one of the following cases is
Q54: Refer to Table 7-3. If this firm
Q75: Suppose RioTintoAlcan is considering the construction of
Q87: Increasing returns to scale for a firm
Q96: Consider the market for any agricultural commodity
Q124: In indifference curve analysis, a point to