Multiple Choice
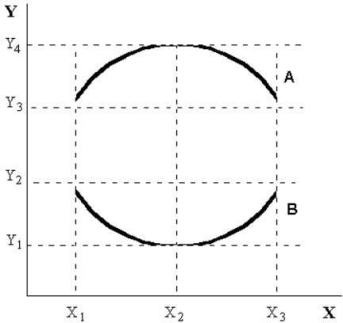 FIGURE 2-3
-Refer to Figure 2-3. On curve A, the maximum value of Y occurs at
Definitions:
Related Questions
Q21: If the mean of a normal distribution
Q29: Refer to Figure 2-5. What is the
Q49: A negative standard deviation indicates that most
Q56: On a coordinate graph with y on
Q57: Refer to Figure 2-3. The slope of
Q67: Under the normal curve, if the mean
Q91: To say that the demand curve for
Q112: Percentage of scores falling between z's of
Q117: With regard to various economic systems, most
Q133: The price elasticity of demand for a