The table below shows the approximate value of Canada's crude oil and natural gas exports over a 5-year period.The amounts shown are billions of dollars.
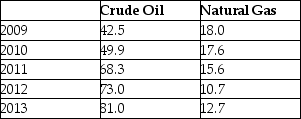 TABLE 2-7
-Refer to Table 2-7.Assume that 2009 is the base year,with an index number = 100.What is the percentage change in the value of exports of crude oil from 2012 to 2013?
Definitions:
Break-Even Point
The point at which total costs and total revenues are equal, meaning a business is not making a profit but also not incurring a loss.
Margin of Safety
The difference between actual or projected sales and the break-even sales level, used to assess risk and financial stability.
Variable Costs
Financial outlays that adjust based on the quantity of products made or the scale of sales transactions.
Fixed Costs
Business expenses that do not change in proportion to the level of goods or services that a company produces over a short term.
Q2: On a normal distribution with a mean
Q6: Refer to Figure 4-2. In diagram 1,
Q9: If the value of the standard deviation
Q15: Descriptive statistics provide symbolic techniques for describing
Q37: Suppose that as the price of some
Q46: If a theoryʹs prediction is tested and
Q59: If household income increases by 50% and
Q100: Which of the explanations below best describes
Q123: The time period to which quantity demanded
Q148: Refer to Table 3-1. How many dozens