Multiple Choice
Use the figure below to answer the following questions.
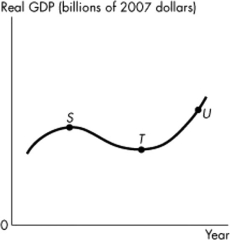 Figure 4.3.1
-Refer to Figure 4.3.1.In the figure, the distance between points S and T represents
Definitions:
Related Questions
Q14: The winners from a tariff on imports
Q24: Given Fact 2.3.2, the opportunity cost of
Q24: The demand curve is P = 800
Q56: The supply curve of a good slopes
Q60: According to the Ricardo- Barro effect, government
Q65: If the economy's capital increases over time,<br>A)gross
Q66: In the market for loanable funds, a
Q74: A rise in the real interest rate<br>A)shifts
Q83: Counting discouraged searchers as unemployed would<br>A)not change
Q145: The law of demand applies to food