Use the figure below to answer the following question.
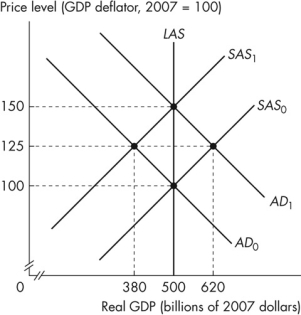 Figure 12.2.1
-Refer to Figure 12.2.1.The figure illustrates an economy initially in equilibrium at the intersection of the SAS0 curve and the AD0 curve.Which of the following shifts the short- run aggregate supply curve from SAS0 to SAS1?
Definitions:
Physiological
Relating to the functions of living organisms and their parts.
Stress Episode
A single or series of stressful events that disrupt an individual's emotional equilibrium and may lead to a physical or psychological response.
Reactions
are the responses or behaviors displayed by individuals in response to external stimulus, events, or changes, often showcasing emotions or thought processes.
American Psychological Association
A professional organization representing psychologists in the United States, dedicated to advancing psychology as a science and profession.
Q1: Monika will choose to eat a seventh
Q21: Refer to Figure 13.3.1, which shows the
Q35: Consider Fact 11.1.1.The marginal propensity to save
Q61: A recessionary gap is the amount by
Q67: According to real business cycle theory, an
Q113: Consider an economy starting from a position
Q131: Individuals A and B can both produce
Q156: Sally has to decide whether to study
Q163: The marginal propensity to import is equal
Q165: Refer to Figure 11.2.1.When real GDP is