Use the figure below to answer the following questions.
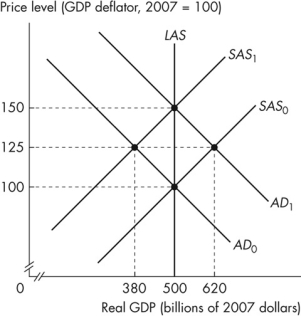 Figure 12.2.3
-Refer to Figure 12.2.3.Assume that the figure illustrates an economy initially in equilibrium at the intersection of the SAS0 curve and the AD0 curve.If the aggregate demand curve is expected to shift to AD1 but remains at AD0, the new equilibrium real GDP is _______ and the new equilibrium price level is _______.
Definitions:
Quantities
The amount or number of a material or immaterial good considered as a unit or in discrete portions.
Industrialized Countries
Nations with significant industrial activity, high levels of income per capita, and widespread infrastructure.
Paasche Index
Amount of money at current-year prices that an individual requires to purchase a current bundle of goods and services divided by the cost of purchasing the same bundle in a base year.
Nominal Income
The amount of money received in a specified period before adjusting for inflation.
Q5: All points on the PPF are points
Q34: Reducing a tariff _ the domestic production
Q35: An economy is in long- run equilibrium
Q48: Given the data in Table 1A.4.2, suppose
Q49: Which of the following issues is a
Q76: The overnight loans rate is the interest
Q101: Refer to Figure 12.2.3.Assume that the figure
Q121: Consider a PPF that measures the production
Q142: Markets I.enable buyers and sellers to get
Q151: The formula for the multiplier in an