Use the figure below to answer the following questions.
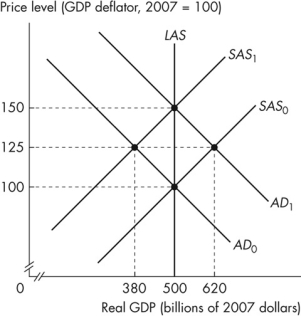 Figure 12.2.3
-Refer to Figure 12.2.3.Assume that the figure illustrates an economy initially in equilibrium at the intersection of the SAS0 curve and the AD0 curve.If the aggregate demand curve is correctly expected to shift to AD1, new equilibrium real GDP is _______ and the new equilibrium price level is _______.
Definitions:
Market Prices
The current price at which an asset or service can be bought or sold, determined by supply and demand in an open market.
Entrepreneurs
Individuals who start, manage, and assume the risks of a business or enterprise, often introducing innovations or exploring new market opportunities.
Costs of Production
The total expenses incurred in manufacturing a product or providing a service, including raw materials, labor, and overheads.
Competitive Conditions
The characteristics of a market where multiple sellers are trying to attract the same buyers, leading to benefits for consumers through lower prices and better quality.
Q16: Refer to Figure 1A.2.2.The variables x and
Q27: Which one of the following can start
Q34: Refer to Table 10.3.3.With no interference from
Q40: The Bank of Canada raises the overnight
Q52: If consumption is $8,000 when disposable income
Q55: Which of the following is an example
Q67: According to real business cycle theory, an
Q68: Refer to Figure 11.2.1.When real GDP is
Q75: Which of the following describes comparative advantage?<br>A)Jane
Q129: Given the data in Table 1A.4.1, holding