Use the figure below to answer the following questions.
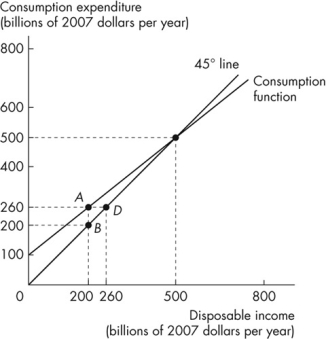 Figure 11.1.1
This figure describes the relationship between consumption expenditure and disposable income for an economy.
-Refer to Figure 11.1.1.The marginal propensity to consume for this economy is
Definitions:
Q8: A tax cut on capital income<br>A)does not
Q41: Refer to Fact 11.5.1.If autonomous consumption increases
Q52: In a market that moves from a
Q67: Refer to Figure 10.3.1.Short- run macroeconomic equilibrium
Q70: Refer to Table 12.4.1.The table gives points
Q80: Refer to Table 15.1.2.The table shows a
Q99: Refer to Table 12.4.1.The table gives points
Q117: Refer to Figure 10.3.3a.You might expect the
Q121: Refer to Figure 10.2.1.Which graph illustrates the
Q127: Beginning at a long- run equilibrium, an