Use the figure below to answer the following questions.
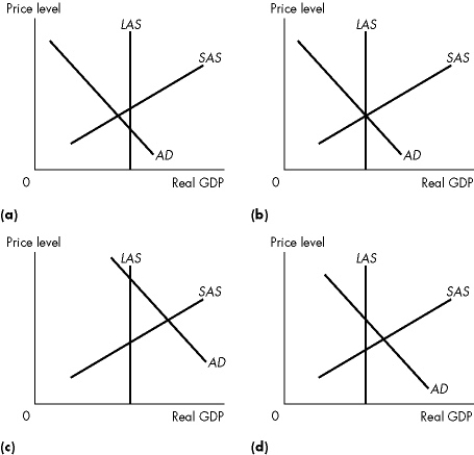 Figure 10.3.3
-Refer to Figure 10.3.3.In which of the graphs would we predict that eventually the price level will rise and real GDP will fall, everything else remaining the same?
Definitions:
Sample Size
The number of subjects included in a study, influencing the study's ability to reliably detect effects or differences.
Type I Error
The incorrect rejection of a true null hypothesis, often referred to as a "false positive."
Type II Error
A statistical mistake that occurs when a test fails to reject a false null hypothesis.
Homogeneous Sample
A sample in which all the subjects or items have similar characteristics or attributes.
Q8: Classical macroeconomists recommend<br>A)policies that actively offset changes
Q14: Suppose that a country's private saving is
Q18: Which statement below best expresses the relationship
Q46: The two big economic questions<br>A)involve neither self-
Q73: Refer to Table 10.3.1.The economy eventually moves
Q78: Everything else remaining the same, which one
Q103: If a basket of goods costs $1000
Q144: The most important skills needed for an
Q154: Select the best statement about economic models.<br>A)Economic
Q155: Consider Fact 11.1.1.When disposable income increases from