The diagram below shows the demand and supply curves for refrigerators in Canada.
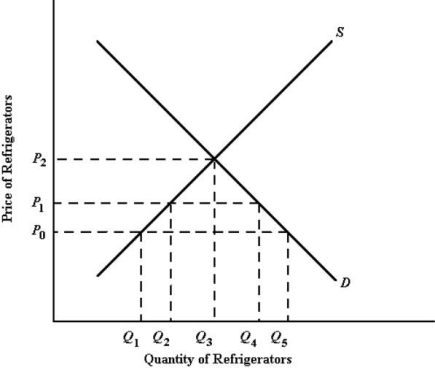 FIGURE 34- 1
-Refer to Figure 34- 1. Suppose that P0 is the world price. If Canada imposes a tariff causing the price of refrigerators in Canada to rise from P0 to P1, the Canadian government will collect tariff revenues equal to
Definitions:
Refuted
Successfully argued against a statement or theory, proving it to be wrong or false.
Well-Established Theories
Theories that have been widely accepted and validated through substantial evidence and scientific inquiry.
Studied Problem
An issue or challenge that has been the subject of detailed examination and research to understand its nature and find solutions.
Pseudoscience
A body of explanations or hypotheses that masquerades as science.
Q4: "Supply inflation" refers to<br>A)the increase in the
Q13: The division of the gains of trade
Q16: Consider the following statement: "Without a doubt,
Q31: Complete the following sentence.Economic models<br>A)were first developed
Q48: When a firm sells its product abroad
Q67: Which of the following is a normative
Q81: A rise in the quantity demanded of
Q85: Other things being equal, a macroeconomic shock
Q102: Canada's balance of payments is sometimes incorrectly
Q105: When a farmer decides to harvest tomatoes