The diagram below shows supply and demand curves for bicycles in the domestic Canadian market. Assume that all bicycles are identical.
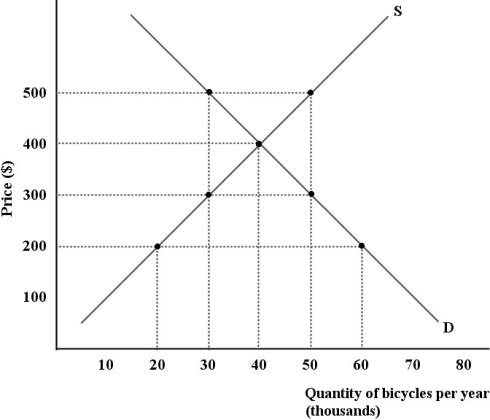 FIGURE 34- 4
-Refer to Figure 34- 4. Suppose the world price of bicycles is $200 and Canada has in place a 50- percent tariff on this good. The deadweight loss to the Canadian economy resulting from this tariff is per year.
Definitions:
Tax
Compulsory financial charges imposed by a government on individuals and organizations to fund public expenditures.
Good
An item or product that satisfies a want or need, available for sale or trade.
Market Demand
The total quantity of a good or service that all consumers in the market are willing and able to purchase at different prices.
Market Supply
The total quantity of a good or service that all producers in a market are willing and able to sell at various price levels.
Q29: Suppose a free- trade agreement with Central
Q41: Refer to Fact 11.5.1.If autonomous consumption increases
Q52: New Classical theories of the labour market
Q54: Suppose that Canada's central bank fixes the
Q63: Which of the following actions (all of
Q66: Refer to Figure 33- 3. Starting from
Q93: Consider the following events: Event 1: Growth
Q128: Foreign exchange dealers expect the Canadian dollar
Q138: The relationship between two variables that are
Q157: Which one of the following is an