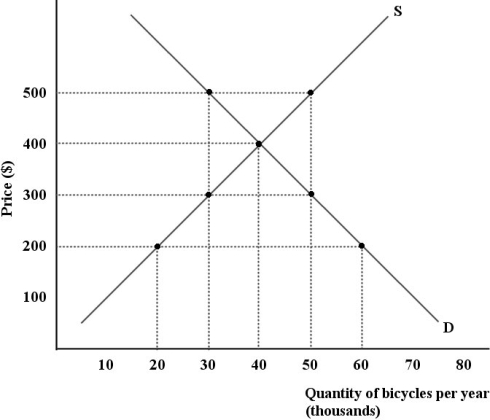
The diagram below shows supply and demand curves for bicycles in the domestic Canadian market. Assume that all bicycles are identical.
 FIGURE 34- 4
-Refer to Figure 34- 4. Assume there is free trade in bicycles. At a world price of $300, Canada's will be bicycles per year.
Definitions:
Price Cuts
A reduction in the selling price of goods or services, usually to stimulate demand or compete more effectively.
Price War
Successive, competitive, and continued decreases in the prices charged by firms in an oligopolistic industry. At each stage of the price war, one firm lowers its price below its rivals’ price, hoping to increase its sales and revenues at its rivals’ expense. The war ends when the price decreases cease.
OPEC
The Organization of the Petroleum Exporting Countries, a group of oil-producing nations that coordinates policies to control the supply and influence the price of oil on the global market.
Oil Cartel
An alliance of oil-producing countries or companies that agree to control oil production levels and prices, often to exert influence on the global market.
Q23: The theory that patterns of international trade
Q33: For most products, Canada is a small
Q53: The actual unemployment rate equals the natural
Q61: A good example of an outcome that
Q81: An incentive<br>A)could be either a reward or
Q84: Canadian firms' receipts from foreign consumers arising
Q87: The policy objective of an annually balanced
Q97: Refer to Table 34- 1. Assuming that
Q104: Until the onset of the most recent
Q107: The capital- service account in Canada's balance-