Refer to the graph below, showing the market supply and demand for a product.Assume that the market is initially in equilibrium where D1 and S1 intersect.If consumer incomes decreased and production costs increased, then new equilibrium would be at: 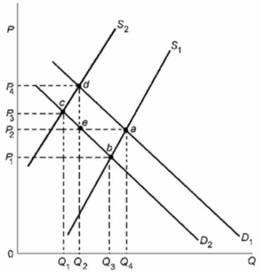
Definitions:
Supply and Demand
The fundamental economic model that describes the interaction between the availability of a particular product and the desire for that product, determining its price.
Deadweight Loss
A loss of economic efficiency that occurs when the optimal level of supply and demand is not achieved.
Supply Elasticities
Measures the responsiveness of the quantity supplied of a good to a change in its price.
Excise Tax
A tax imposed on specific goods, services, or transactions, often used to discourage consumption of certain products or to raise government revenue.
Q12: What combination of changes in supply and
Q46: <img src="https://d2lvgg3v3hfg70.cloudfront.net/TB6686/.jpg" alt=" In the above
Q50: Government fiscal policy involves changing which of
Q54: We observe a market in which the
Q67: In what way, if any, does the
Q133: You are asked to determine, other things
Q143: Refer to the above graph.X and Y
Q211: Unemployment and/or productive inefficiencies:<br>A)cause the production possibilities
Q249: The study of economics exists because:<br>A)government interferes
Q257: <img src="https://d2lvgg3v3hfg70.cloudfront.net/TB6686/.jpg" alt=" Refer to the