Use the graph below to explain the determination of equilibrium GDP by the aggregate expenditures-domestic output approach.At equilibrium C + Ig = Real GDP ($550 + $50 = $600).Why does the intersection of the aggregate expenditures schedule and the 45-degree line determine the equilibrium GDP? 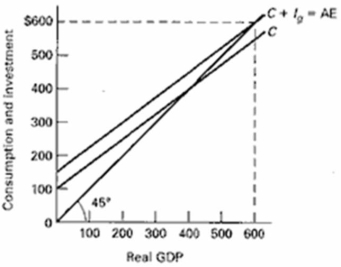
Definitions:
Similar
Resembling without being identical; having qualities in common or a close resemblance.
Same
Identical; exactly alike or equal in some specified quality or characteristic.
Likeness
The state, quality, or fact of being similar or akin to something else.
Constant
A value that remains unchanged and is not affected by other parameters in a given situation.
Q8: Describe the impact of an increase in
Q10: What is a balance of payments deficit?
Q10: In this list, identify those investments which
Q12: Show graphically on the below graph the
Q14: State four factors that explain why investment
Q25: What is consumer surplus?
Q28: Assume the atmosphere of an urban area
Q29: Of what use is national income accounting
Q29: Using the schedules given, plot the demand
Q64: <img src="https://d2lvgg3v3hfg70.cloudfront.net/TB6686/.jpg" alt=" Refer to the