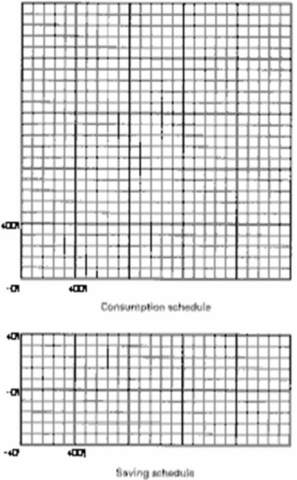
Complete the accompanying table.  Using the below graphs, show the consumption and saving schedules graphically.
  (b) Locate the break-even level of income.How is it possible for households to dissave at very low income levels?
(c) If the proportion of total income consumed decreases and the proportion saved increases as income rises, explain both verbally and graphically how the MPC and MPS can be constant at various levels of income.
Definitions:
Demand Curve
A pictorial representation that maps out the correlation between a good's price and its demand over an allotted time.
Laws of Supply and Demand
Economic principles stating that the price of a good is directly related to its availability (supply) and the desire for it (demand), with high demand and low supply leading to high prices, and vice versa.
Price
The sum of money needed to buy a product, service, or asset.
Buyer
A person or organization that buys products or services for private use or consumption.
Q3: Refer to the graph.The movement from line
Q11: Answer the following questions regarding international trade:(a)
Q14: Which types of industries are hit hardest
Q22: What is the long-run equilibrium in the
Q35: Describe the nature, causes, and effects of
Q59: Refer to Figure 9.6. In the short
Q61: An increase in government expenditure has a
Q119: Refer to the diagram below.The concept of
Q136: Production possibilities (alternatives) <img src="https://d2lvgg3v3hfg70.cloudfront.net/TB6686/.jpg" alt="Production possibilities
Q149: <img src="https://d2lvgg3v3hfg70.cloudfront.net/TB6686/.jpg" alt=" Answer on the