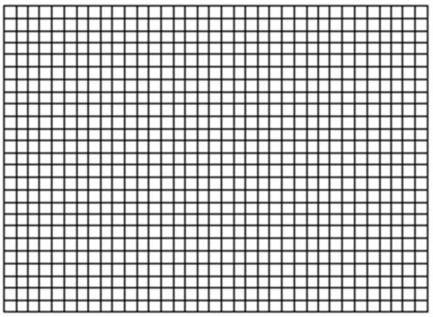
Using the schedules given, plot the demand curve and the supply curve on the below graph.Label the axes and indicate for each axis the units being used to measure price and quantity.Then answer the questions. 
 (a) Give the equilibrium price and quantity for wheat.(b) Indicate the equilibrium price and quantity on the graph by drawing lines from the intersection of the supply and demand curves to the price and quantity axes.(c) If the Federal government decided to support the price of wheat at $4.00 per ton, tell whether there would be a surplus or shortage and how much it would be.(d) Demonstrate your answer to part (c) on your graph being sure to label the quantity you designated as the shortage or surplus.
Definitions:
Product Descriptors
Terms or phrases used to describe key attributes or features of a product to consumers.
Product Features
Attributes or characteristics of a product that are intended to offer benefits and solve consumers' problems.
Brand Marks
Visual symbols or logos that identify a brand, making it recognizable to consumers.
Differentiation
The process of distinguishing a product or service from others, to make it more attractive to a particular target market.
Q2: Newspaper item: "Due to lower grain prices,
Q4: What fiscal policy is most likely to
Q23: What three key statistics do macroeconomists study
Q30: Trace the cause-effect chain that results from
Q33: Give an equation that shows the relationship
Q35: During which phases of the business cycle
Q79: Refer to Figure 9.2. Suppose the economy
Q103: In an economy with no government or
Q105: The country of Needia has recently suffered
Q118: According to the application, shocks to aggregate