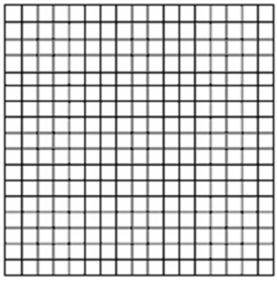
A production possibilities table for two products, corn and paper, is found below.Usual assumptions regarding production possibilities are implied.Corn is measured in tons, and paper is measured per unit.  (a) Using the following graph construct a production possibilities curve from this information placing corn on the vertical axis and paper on the horizontal axis.
  (b) What is the marginal opportunity cost of producing the first unit of paper? The marginal opportunity cost of producing the fourth unit of paper?
Definitions:
Q7: Determine the equilibrium price and quantity in
Q30: If prices are "stuck" and there is
Q35: Use the data in the following table
Q37: What is inflation and how is it
Q60: When we draw the aggregate demand curve,
Q74: Refer to Figure 9.5. Suppose the economy
Q84: Which of the following would cause the
Q114: Based on growth accounting, which of the
Q147: Using aggregate supply and aggregate demand curves,
Q168: Foreign investment can increase a country's capital