Refer to the figure given below. 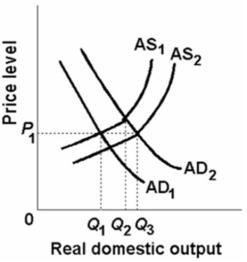 In the above figure, AD1 and AS1 represent the original aggregate demand and aggregate supply curves, respectively.AD2 and AS2 show the new aggregate demand and aggregate supply curves.At the original equilibrium price and quantity, this economy is experiencing:
Definitions:
P = MC
An economic condition where price equals marginal cost, indicating optimal resource allocation in perfectly competitive markets.
Optimally Allocated
Refers to the distribution of resources in a manner that maximizes efficiency and effectiveness, often resulting in the best possible outcome.
Short-Run Supply
The total quantity of goods and services that producers are willing and able to sell at current prices in a short-term period, often influenced by fixed production capacities.
Long-Run Supply
The total amount of a product or service that is available to the market from all producers over a long period, when all inputs can be adjusted.
Q2: Suppose that real domestic output in an
Q30: The short-run aggregate supply curve is upward-sloping
Q79: A contractionary fiscal policy shifts the aggregate
Q95: During the recession of 2008-2009, both after-tax
Q109: Which of the following is likely to
Q126: <img src="https://d2lvgg3v3hfg70.cloudfront.net/TB6686/.jpg" alt=" Refer to the
Q132: If the desired reserve ratio falls:<br>A)banks would
Q137: If a consumption schedule shifts upward, this
Q149: Assume that a machine, which has a
Q160: Increased government spending for investments such as