Refer to the figure below. 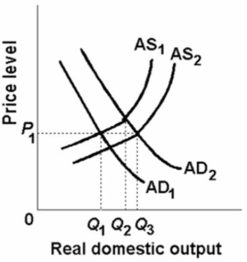 In the above figure, AD1 and AS1 represent the original aggregate demand and aggregate supply curves, respectively.AD2 and AS2 show the new aggregate demand and supply curves.The changes in aggregate demand and aggregate supply result in a(n) :
Definitions:
Numerator
The top number in a fraction, representing the part of the whole or the dividend in division.
Chi-square Distribution
A statistical distribution that describes the distribution of the sum of the squares of a set of variables, often used in hypothesis testing.
Random Variable
A variable that can take on numerical values based on the outcomes of a random event.
Value
The importance, worth, or usefulness of something or a numerical quantity measured or assigned or computed.
Q55: The simple multiplier may be calculated as:<br>A)1/(MPS
Q71: In an open economy, the multiplier is
Q71: When a chartered bank has "excess reserves":<br>A)it
Q101: The letters Y, C, I<sub>g</sub>, X, and
Q122: The following table illustrates the multiplier process
Q127: A decrease in consumer spending can be
Q150: Which of the following best describes the
Q160: All else equal, a large decline in
Q164: An increase in aggregate demand is most
Q172: As disposable income goes up the:<br>A)APC falls.<br>B)APS