The table below shows the maximum amounts of food and clothing that two nations, A and B, can produce.Draw the production possibilities curve for A and B using the below graphs.Assume constant costs. 
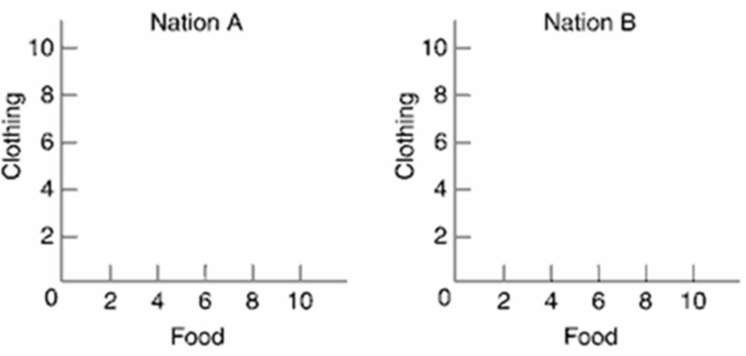 (a) What is the cost ratio for the two products?(b) If each nation specializes according to comparative advantage, who should produce and trade each product? Why?(c) What will be the range for the terms of trade? If the terms are set at 1 food = 2 clothing, show how the trading possibilities lines will change in the graph.Explain.
Definitions:
Tax System
The structured method by which a government or authority levies taxes on individuals, businesses, and transactions.
U.S. Economy
The economic system of the United States, characterized by a mixture of private and public enterprise and known for being one of the world’s largest and most complex economies.
Income
The financial gain received by an individual or entity, typically through wages, profits, rents, or investments.
Government Revenues
The total money received by the government from various sources, including taxes, fees, and other charges.
Q13: The table below contains hypothetical international balance
Q17: What are three significant generalizations regarding the
Q19: Use the table below to answer the
Q20: What are two broad categories of macroeconomic
Q22: Assume the atmosphere of an urban area
Q39: When an economy is operating with maximum
Q177: In recent years, there has been a
Q179: What combination of changes in supply and
Q260: The "economic perspective" refers to:<br>A)macroeconomic phenomena, but
Q269: Refer to the table below. <img src="https://d2lvgg3v3hfg70.cloudfront.net/TB6686/.jpg"