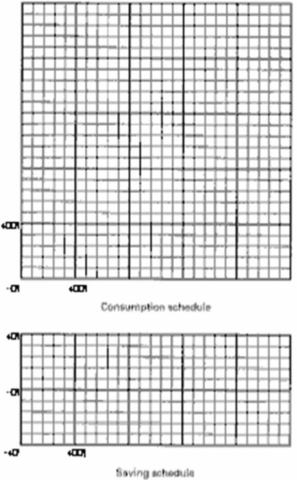
Complete the accompanying table.  Using the below graphs, show the consumption and saving schedules graphically.
  (b) Locate the break-even level of income.How is it possible for households to dissave at very low income levels?
(c) If the proportion of total income consumed decreases and the proportion saved increases as income rises, explain both verbally and graphically how the MPC and MPS can be constant at various levels of income.
Definitions:
Social Costs
The total cost to society, including both the private costs borne by producers and also any external costs to others not involved in the transaction.
Social Benefits
The aggregate advantage to society derived from the production or consumption of a product, encompassing both individual benefits and any additional external advantages.
Pay-per-view Movies
A service that allows consumers to pay for individual movies to watch rather than subscribing to a broad service offering.
Common Resource
A resource like air or water that is available to all but can be depleted by overuse.
Q4: If the Phillips Curve exists in reality,
Q10: Explain how policy makers Core Inflation data
Q10: Lower class<br>A)Grew throughout much of the twentieth
Q14: What are the consequences for equilibrium price
Q15: Define modern economic growth.When did it seem
Q19: Neoliberalism argues that global free trade will
Q30: Use the table below to answer the
Q36: "Competition is the mechanism that brings order
Q42: Use the figures in the table below
Q69: Is globalization the principal cause of job