Multiple Choice
The figure below shows the isocost lines and the isoquant map for a firm producing golf tees. 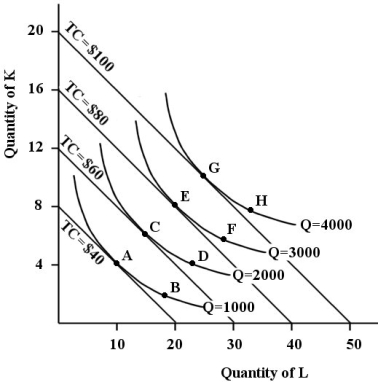 FIGURE 8- 6
-Refer to Figure 8- 6. The cost- minimizing factor combination for producing 2000 golf tees is
Definitions:
Related Questions
Q12: If all consumers in an economy have
Q20: Refer to Figure 8- 4. The firm
Q26: Suppose the free- market equilibrium price for
Q39: Refer to Figure 6- 9. The line
Q56: Refer to Figure 4- 2. In part
Q56: Discuss in detail the meaning of the
Q64: Refer to Table 4- 2. The price
Q72: Refer to Table 7- 4. The average
Q84: When a firm's total- product curve is
Q120: A family of short- run cost curves