Multiple Choice
The figure below shows the isocost lines and the isoquant map for a firm producing golf tees. 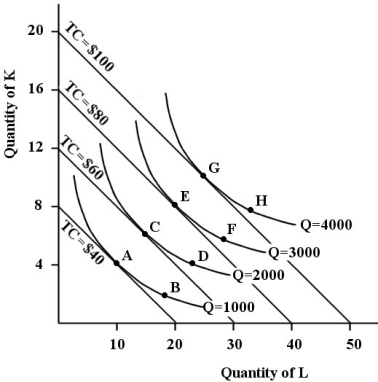 FIGURE 8- 6
-Refer to Figure 8- 6. Suppose this firm is producing 4000 golf tees with 10 units of capital and 25 units of labour. The marginal rate of substitution between capital and labour is
Definitions:
Related Questions
Q16: Feminism is a major influential movement within
Q21: Canada has a much lower population density
Q36: What is the key difference between the
Q57: Refer to Table 9- 2. If the
Q76: Minzee has just been promoted to head
Q80: Suppose Jodi's widget business is using two
Q90: What role do sociologists believe biology has
Q91: A demand curve that is the shape
Q105: Which of the following statements best differentiates
Q120: For a given market price, a competitive