The figure below shows the isocost lines and the isoquant map for a firm producing golf tees. 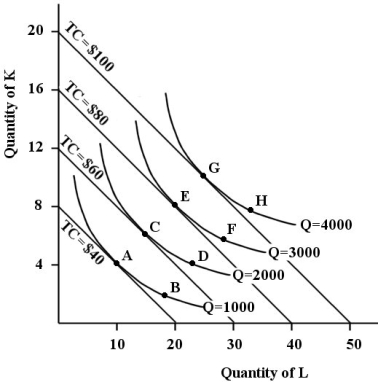 FIGURE 8- 6
-Refer to Figure 8- 6. Suppose the firm is currently producing at point E and the prices of capital and labour each increase by 30 percent. If the firm wants to minimize the cost of producing the same level of output, the firm's chosen factor combination would be at point
Definitions:
Q1: The fact that new methods to extract
Q7: Suppose that when one additional unit of
Q16: Feminism is a major influential movement within
Q31: Refer to Figure 9- 2. If the
Q34: Suppose that in a perfectly competitive industry,
Q44: The point of diminishing marginal productivity is
Q51: If an anthropologist today were to use
Q55: A firm operates at its least- cost
Q61: Consider the market for any agricultural commodity
Q78: Jodi recently went into business producing widgets.