Multiple Choice
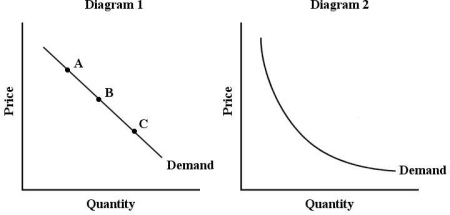 FIGURE 4- 1
-Refer to Figure 4- 1, which shows two demand curves, one linear and the other a rectangular hyperbola. In diagram 1, the price elasticity of demand
Definitions:
Related Questions
Q3: Refer to Figure 8- 6. Suppose this
Q4: In defining a firm's long- run average
Q6: Refer to Figure 4- 2. Demand is
Q12: Suppose that the price of wheat has
Q42: Economists use the notation Q = f(L,K)
Q46: Refer to Figure 34- 3. If Canada
Q59: If country A has wages that are
Q62: Suppose economists at the World Bank discover
Q82: Refer to Figure 5- 7. The market
Q90: A single proprietorship is a form of