The diagram below shows supply and demand curves for bicycles in the domestic Canadian market. Assume that all bicycles are identical.
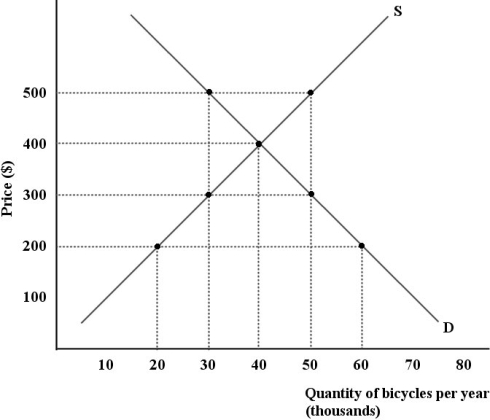 FIGURE 34- 4
-Refer to Figure 34- 4. Suppose the world price of bicycles is $500 and Canada has in place a 50- percent tariff on this good. The deadweight loss to the Canadian economy resulting from this tariff is per year.
Definitions:
Chunking
Chunking is a cognitive strategy that involves breaking down information into smaller, manageable units or chunks, facilitating easier processing and recall of information.
Visual Imagery
The representation of perceptual information in the form of mental pictures or images.
Meaningful Units
Smallest segments of language or symbols that convey a specific meaning, such as words in a sentence or digits in a number.
Mnemonic Technique
A method or strategy used to enhance memory performance, often by associating new information with familiar patterns or structures.
Q1: Suppose that the demand curves for goods
Q19: Which of the following statements about the
Q27: Suppose we observe that movie theatre prices
Q29: Suppose an individual wheat farmer's income is
Q70: Refer to Figure 5- 8. After the
Q71: If Canada reduces the tariff imposed on
Q89: Income elasticity of demand measures the extent
Q91: In competitive markets, price floors and price
Q105: Consider the following two statements. (1) An
Q108: Refer to Figure 33- 4. Suppose that