The diagram below shows the MRP curve for a firm producing high school math textbooks. The factor of production being considered here is hours of labour. 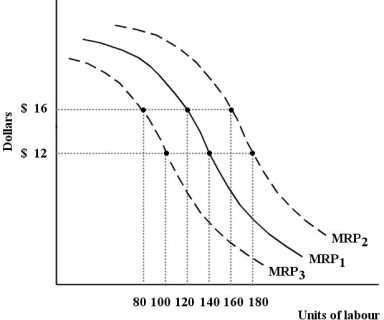 FIGURE 13- 2
-Refer to Figure 13- 2. Suppose this firm initially has the marginal revenue product curve MRP1. One reason that the curve could shift to MRP3 is
Definitions:
Centromeres
Centromeres are regions on a chromosome where spindle fibers attach during cell division, serving as a constriction point that holds sister chromatids together.
Telomerase Catalytic Subunit
A key protein component of telomerase, an enzyme that adds DNA sequence repeats to the telomeres of chromosomes, facilitating cellular replication.
Cell Cycle
A series of phases in the life of a cell, encompassing its growth, DNA replication, and division into two daughter cells.
DNA Synthesis
The process by which a cell's DNA is copied, involving the unwinding of the double helix, nucleotide matching, and the joining of new nucleotides.
Q10: Consider a firm making a decision to
Q12: Equilibrium factor- price differentials<br>A) may be caused
Q29: Refer to Figure 10- 3. The price
Q31: Refer to Figure 17- 3. The MB
Q38: The union wage premium refers to the<br>A)
Q44: A firm in a perfectly competitive labour
Q52: An efficiency argument for public provision of
Q60: Refer to Figure 13- 5. This factor
Q82: A monopolistically competitive firm has some degree
Q89: The term "economic rent" refers to<br>A) economic