The three diagrams below each show a supply curve for oil tankers over a relatively short period of time. 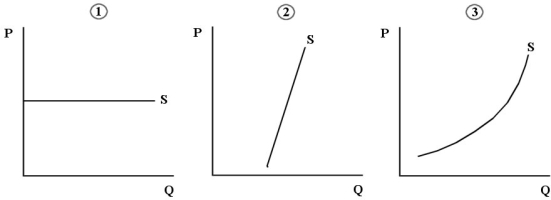 FIGURE 13- 3
-Refer to Figure 13- 3. Consider the supply of oil tankers to an individual Canadian firm, the North American shipping industry, and the world shipping industry. Which diagram best shows the supply of oil tankers that is relevant to an individual Canadian firm?
Definitions:
Richest Nations
Countries that have the highest Gross Domestic Product (GDP) per capita, indicating a high level of economic prosperity and standard of living.
Gross Domestic Product
A measure of the economic performance of a country, representing the total value of all goods and services produced over a specific time period.
United States
A country located in North America, consisting of 50 states, a federal district, and several territories.
China
The world's most populous country, located in East Asia, known for its vast history, diverse culture, and significant economic and political influence.
Q2: Refer to Figure 11- 3. Which of
Q4: An example of a government expenditure that
Q34: A potential disadvantage of emissions taxes versus
Q45: Refer to Figure 18- 1. A lump-
Q54: Which of the following statements about public
Q57: Which of the following statements about a
Q61: A country's production possibilities boundary shows that<br>A)
Q75: Refer to Figure 10- 4. The average
Q84: Productive efficiency (at the level of the
Q119: A monopolist will continue to increase production